Computer Vision Pipeline for Automatic Inspection of PV Plants (PhD Thesis)
Conducted during: PhD at Helmholtz Institute Erlangen‑Nürnberg for Renewable Energy
Topic: Automated processing of aerial infrared videos for the inspection of large-scale photovoltaic plants
Motivation: Globally deployed solar photovoltaic installations have reached a capacity of 627 GWp in 20201 with a projected growth to 2840 GWp in 20302. Typically, PV plants contain about 10 % anomalous PV modules, which can pose safety hazards, power losses and yield losses. Thus, regular inspection of PV plants is required. As PV plants contain tens of thousands to millions of PV modules, manual inspection is economically infeasible, raising the demand for a fully automated inspection solution.
Aim: Develop a flexible, fully automated solution for PV plant inspection that allows for a high throughput and interferes minimally with plant operation.
Problem Statement: Thermal infrared (IR) imaging is used for contactless identification of anomalous PV modules based on heat dissipated in potentially defective regions of the module. The IR camera is carried by a multicopter, which facilitates low cost and high throughput inspections. A software solution is required to automatically process the large amounts of acquired IR videos. Specifically, the software needs to accurately identify anomalous modules among normal ones and it must localize those modules within the plant to facilitate targeted repairs. Furthermore, it should quantify the impact of module anomalies on the power output of the plant.
Method & Results: The developed inspection software comprises of a) a computer vision pipeline for extraction and mapping of individual PV modules, and b) components for performing defect detection of individual PV modules.
a) Computer vision pipeline for extraction and mapping of PV modules:
Input to the pipeline (see fig. 1) are infrared videos and a coarse GPS trajectory (latitude, longitude, and optionally altitude) of the multicopter. Outputs are multiple cropped and rectified image patches of each PV module grouped by a unique ID and geocoordinates of the corner points of each module. The pipeline first segments individual PV modules in each infrared video frame with a Mask R-CNN instance segmentation model. Each module is then tracked over subsequent frames, cropped, rectified, and stored to disk with a unique tracking ID. In publication [1] the module location is determined relative to other modules within a plant row by means of an external plant description file and a graph matching algorithm. In publication [3] a more flexible, layout-independent, and fully automated solution for module localization is proposed. Here, structure from motion is used to reconstruct the 6-DOF camera trajectory as well as 3D feature points (see fig. 2). Since the coarse GPS trajectory is given the reconstruction is provided in WGS84 geocoordinates. Based on the known camera coordinates, PV module corners are triangulated into the 3D reconstruction and refined with an iterative graph optimization, yielding absolute geocoordinates for each PV module (see fig. 3).
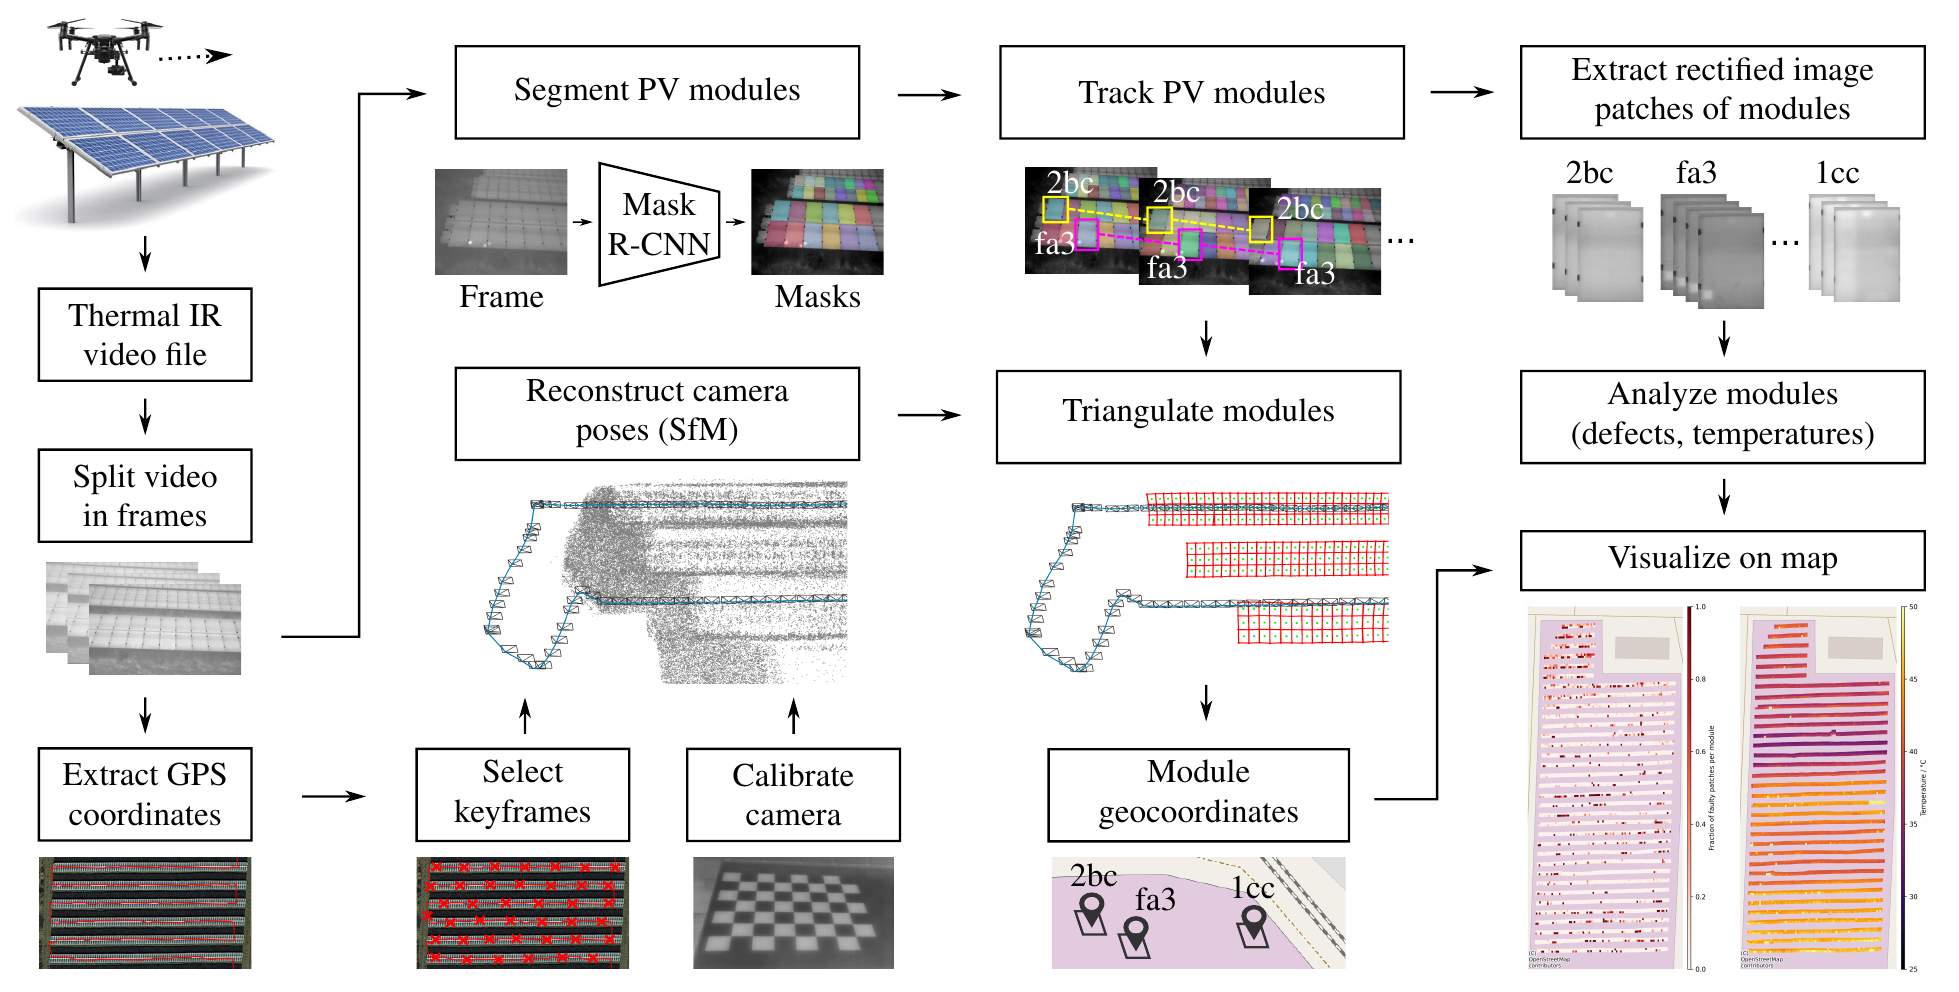 Fig. 1: Computer vision pipeline for extraction and mapping of PV modules from aerial IR videos.
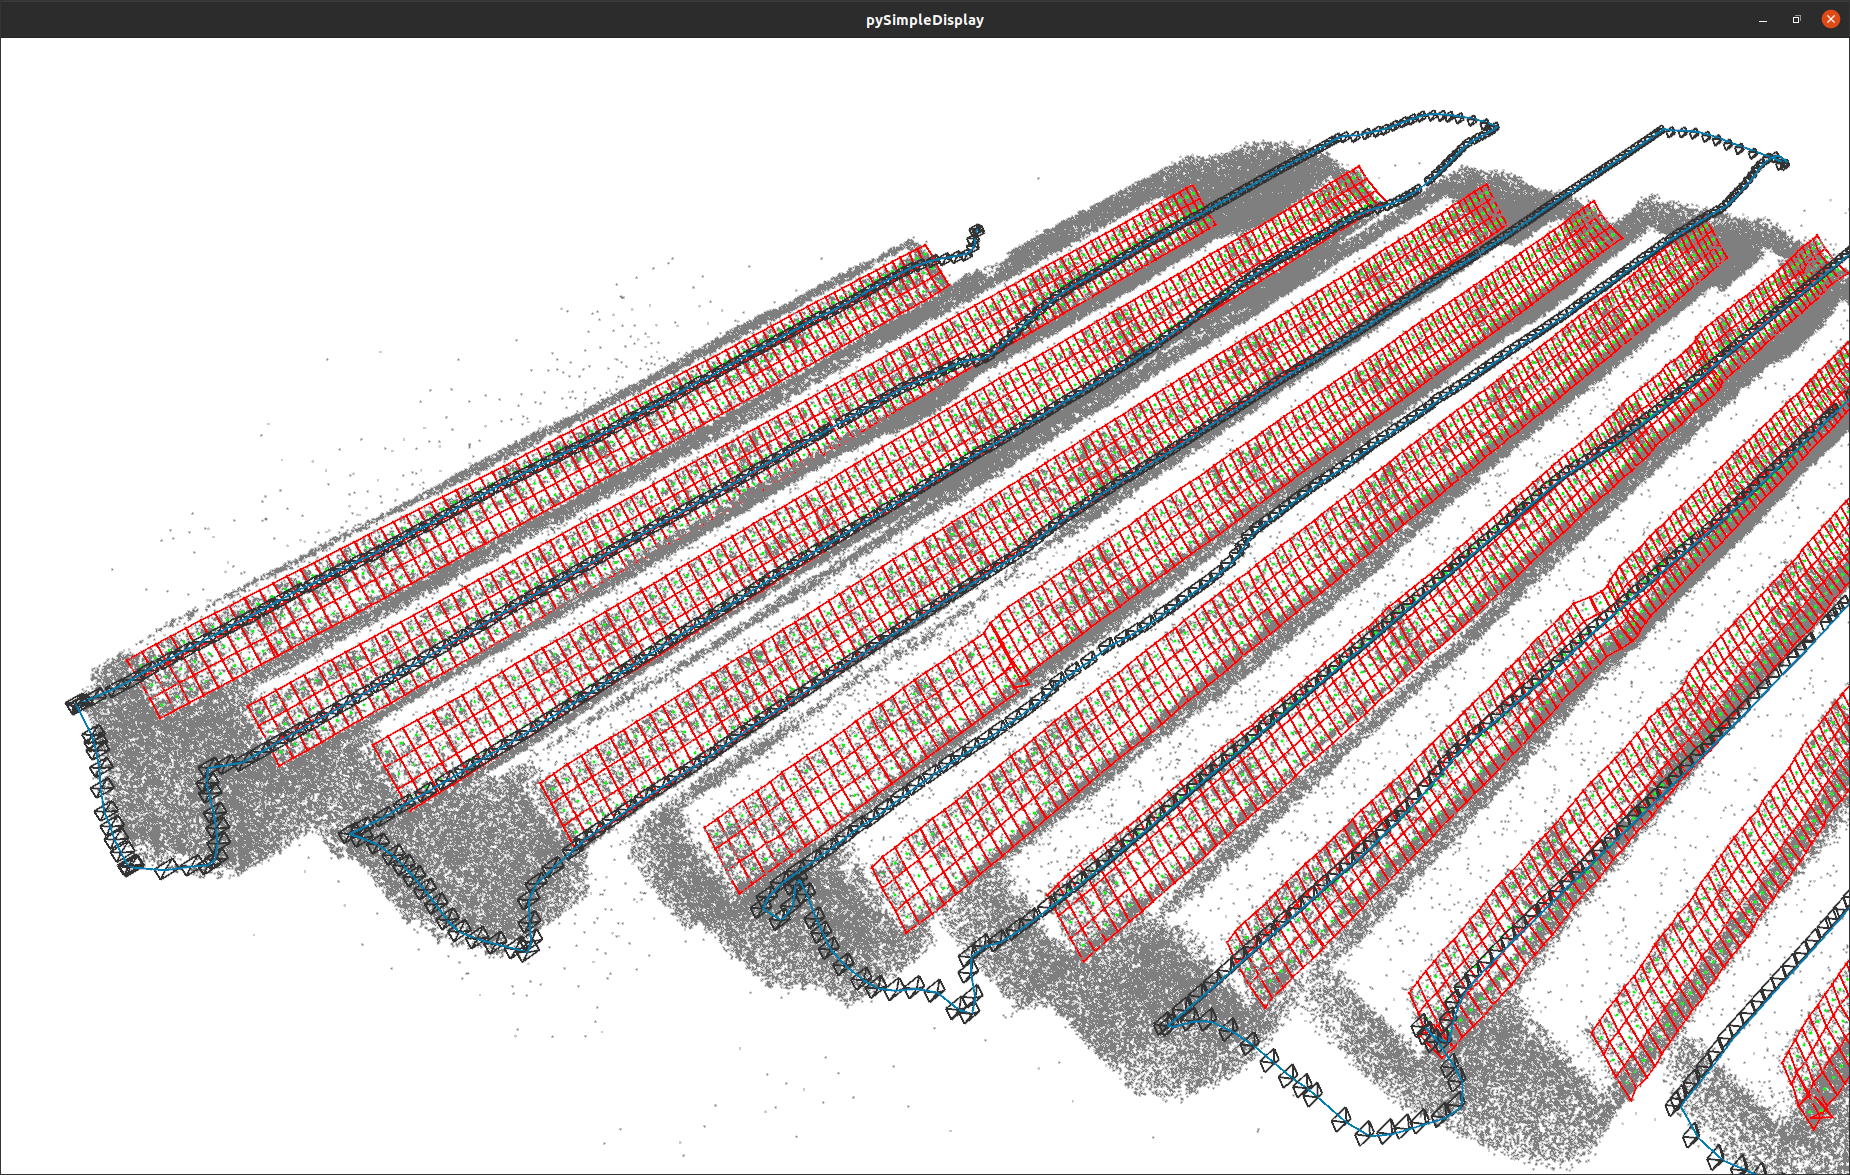 Fig. 2: Reconstruction of a PV plant showing the camera trajectory (blue line and black frustums), feature points (gray) and triangulated PV modules (red).
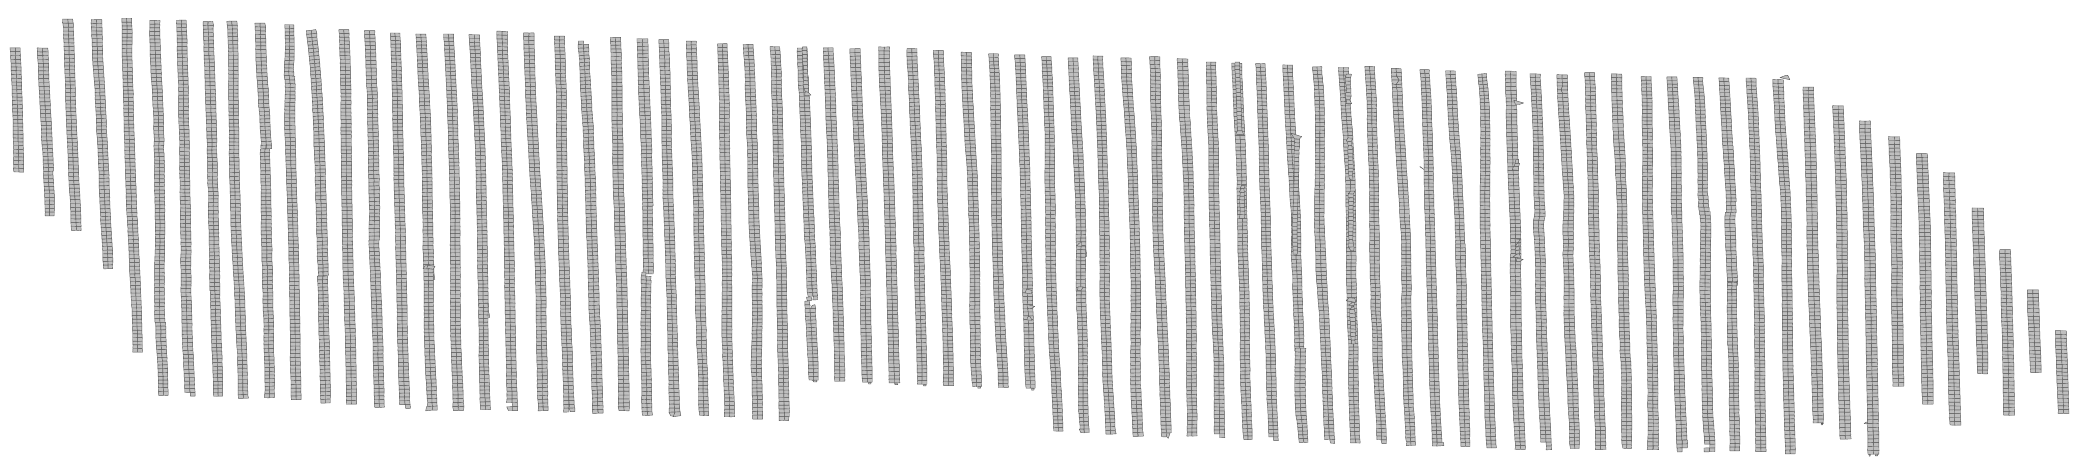 Fig. 3: Map of a PV plant containing 13640 modules obtained with the computer vision pipeline.
b) Detection of anomalous PV modules:
Anomalous modules are identified based on the extracted and rectified image patches of each module. In publication [1], we annotate 4.3 million IR images of over 10700 modules from seven PV plants with ten different anomaly classes (see fig. 4) and train an image classifier based on a ResNet-50 convolutional neural network (CNN), which achieved over 90 percent test accuracy. In publication [2] I find that this earlier approach is not useful for practical applications, where training and test data are drawn from different distributions (different PV plants), which exhibit significant domain shift (see fig. 5). I develop a binary anomaly detection method based on contrastive representation learning (see fig. 6) and a k-nearest neighbor classifier, which is trained on data of one PV plant and evaluated on data of a different plant. This approach overcomes the domain shift due to the higher informativeness of the contrastive representation as opposed to representations learned with a cross-entropy loss. In publication [3] I investigate a simpler and more practical anomaly detection method based on module temperatures (see fig. 7), which requires no training, is easier to interpret and achieves a similar accuracy as the deep learning methods.
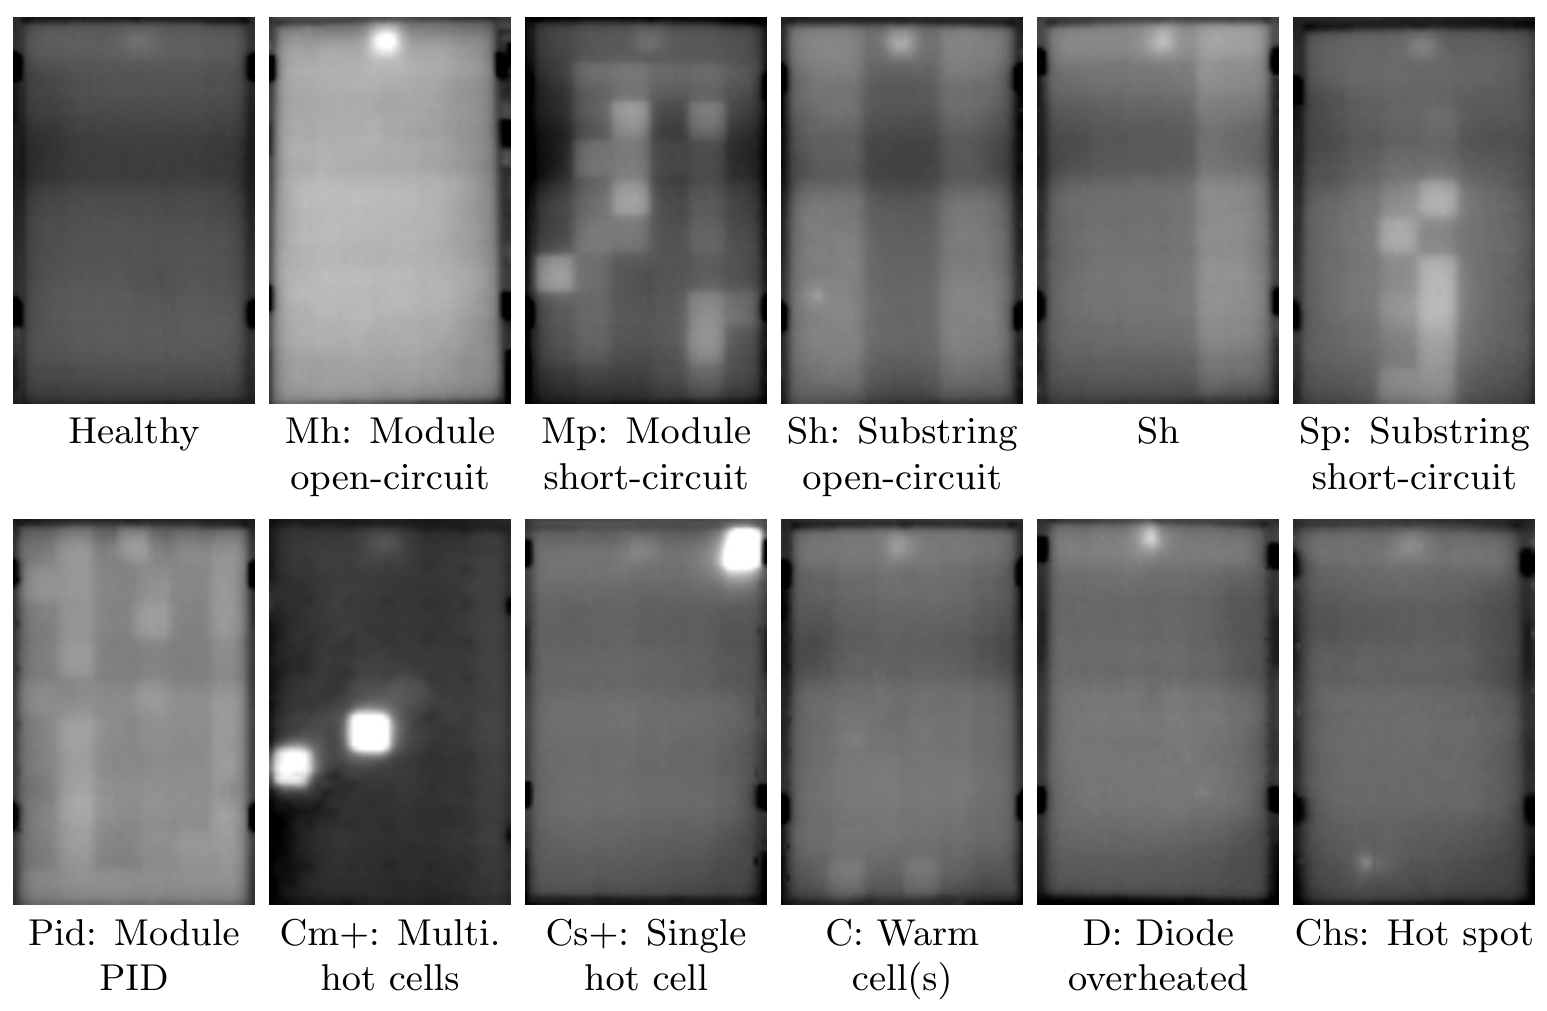 Fig. 4: IR images of PV modules with different types of anomalies.
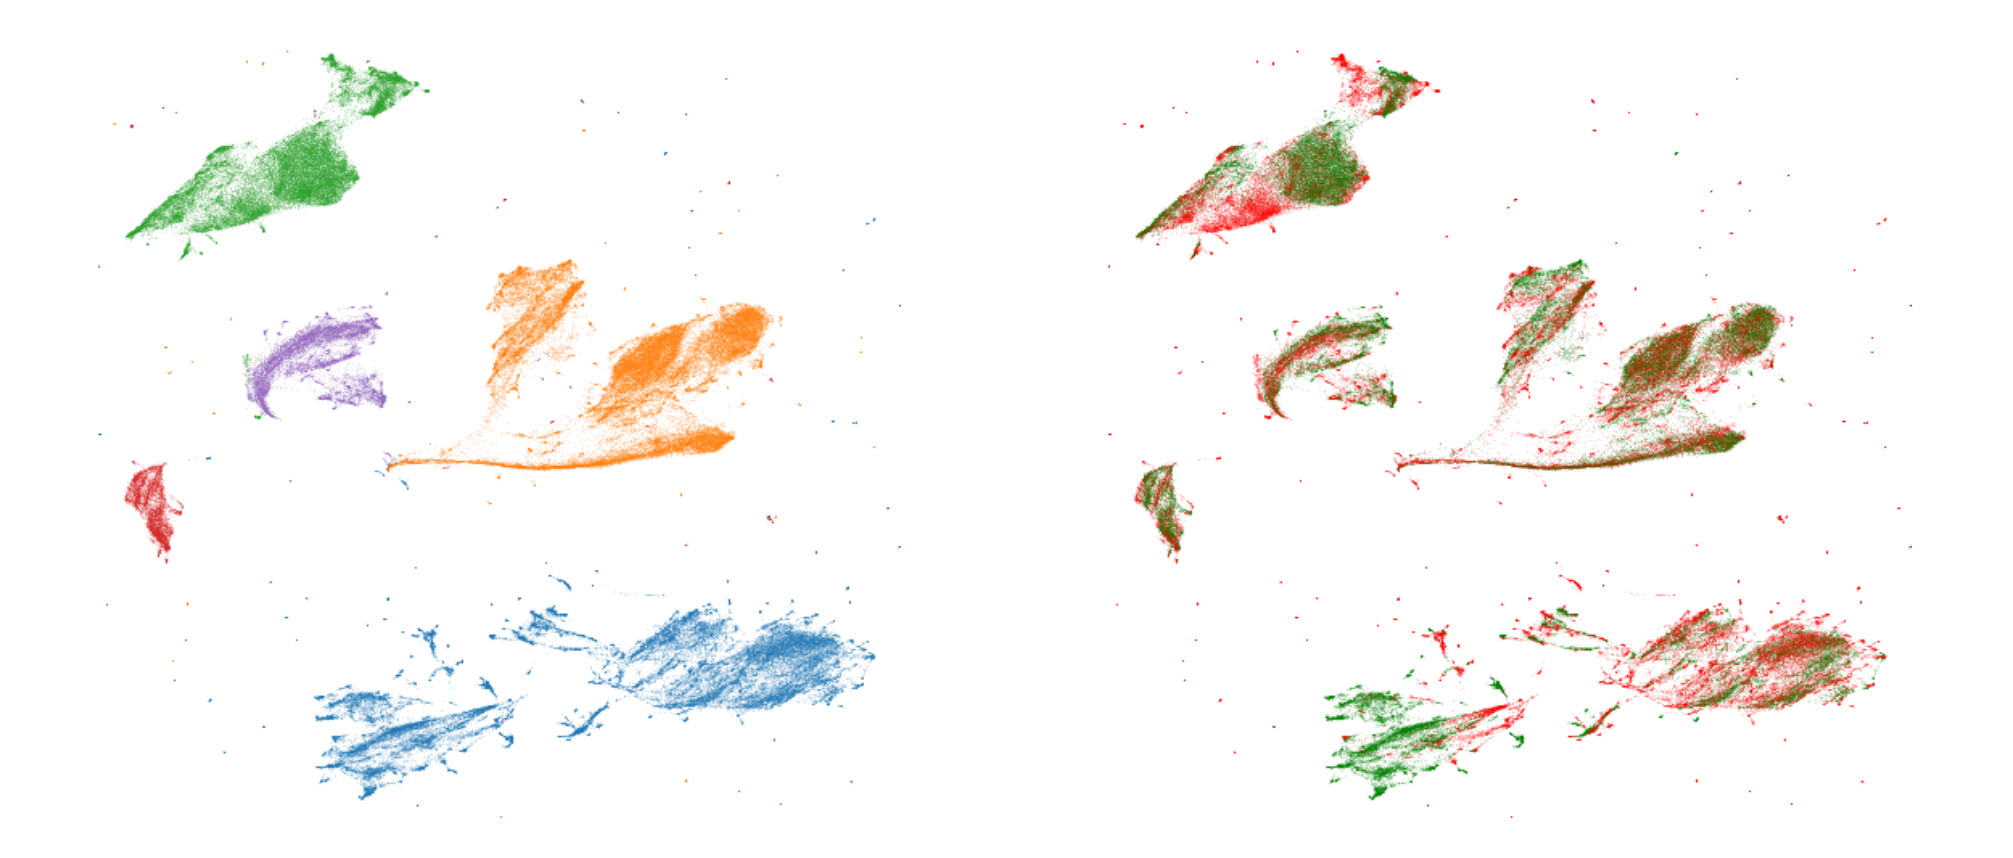 Fig. 5: Embeddings of IR images in our dataset. Images form subdomains for different PV plants (left), but do not exhibit significant clustering of normal (green) versus anomalous (red) PV modules (right).
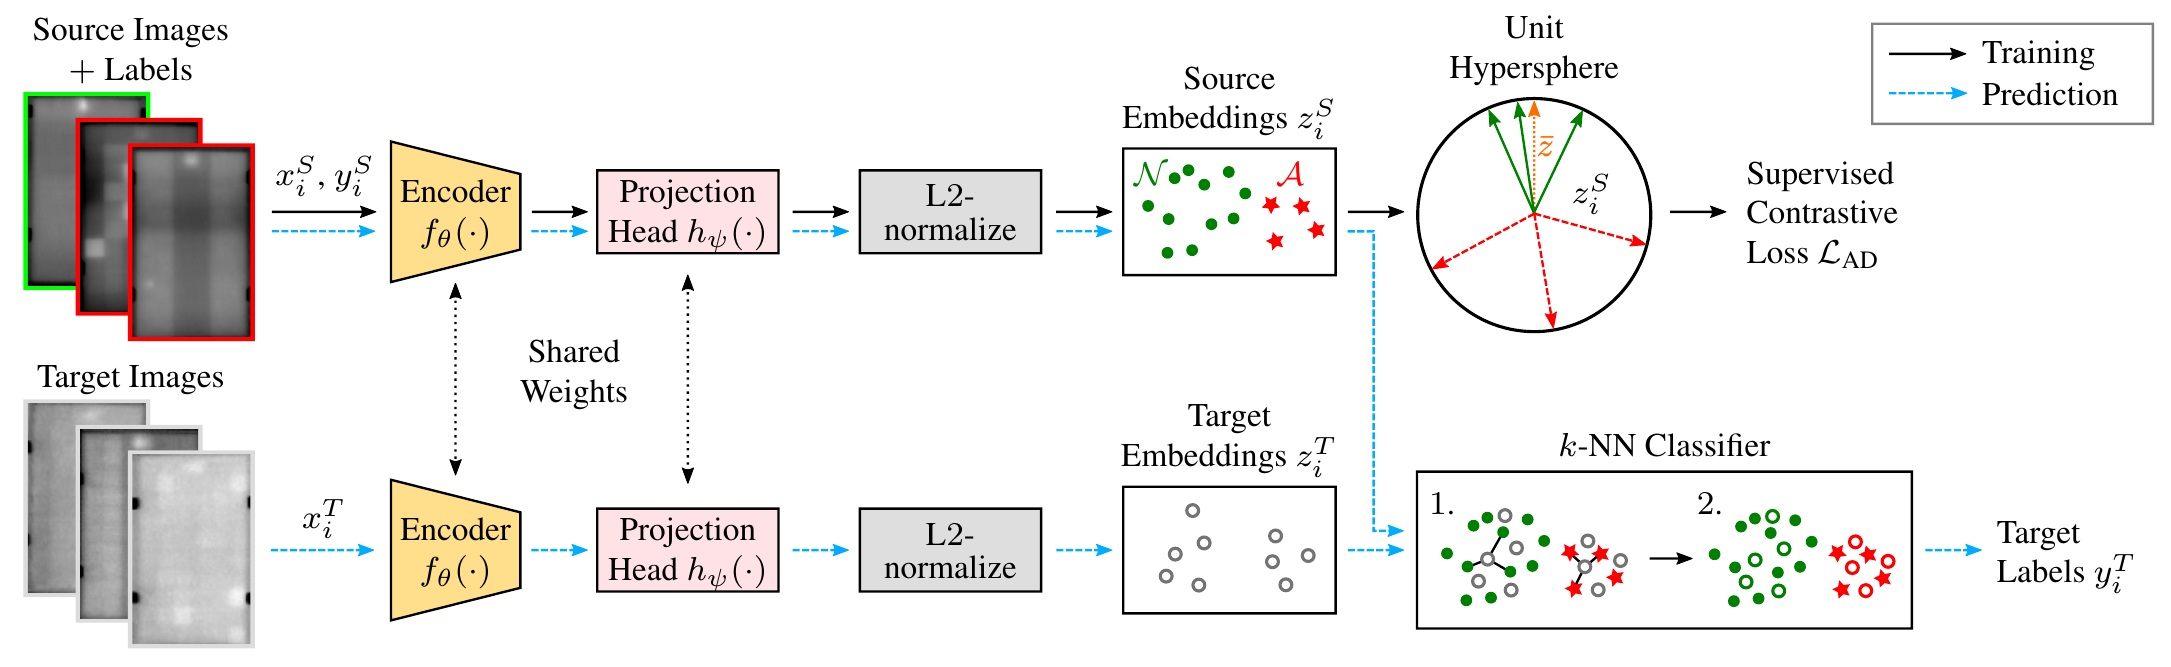 Fig. 6: Method for binary PV module anomaly detection based on contrastive representation learning and a k-nearest neighbor classifier.
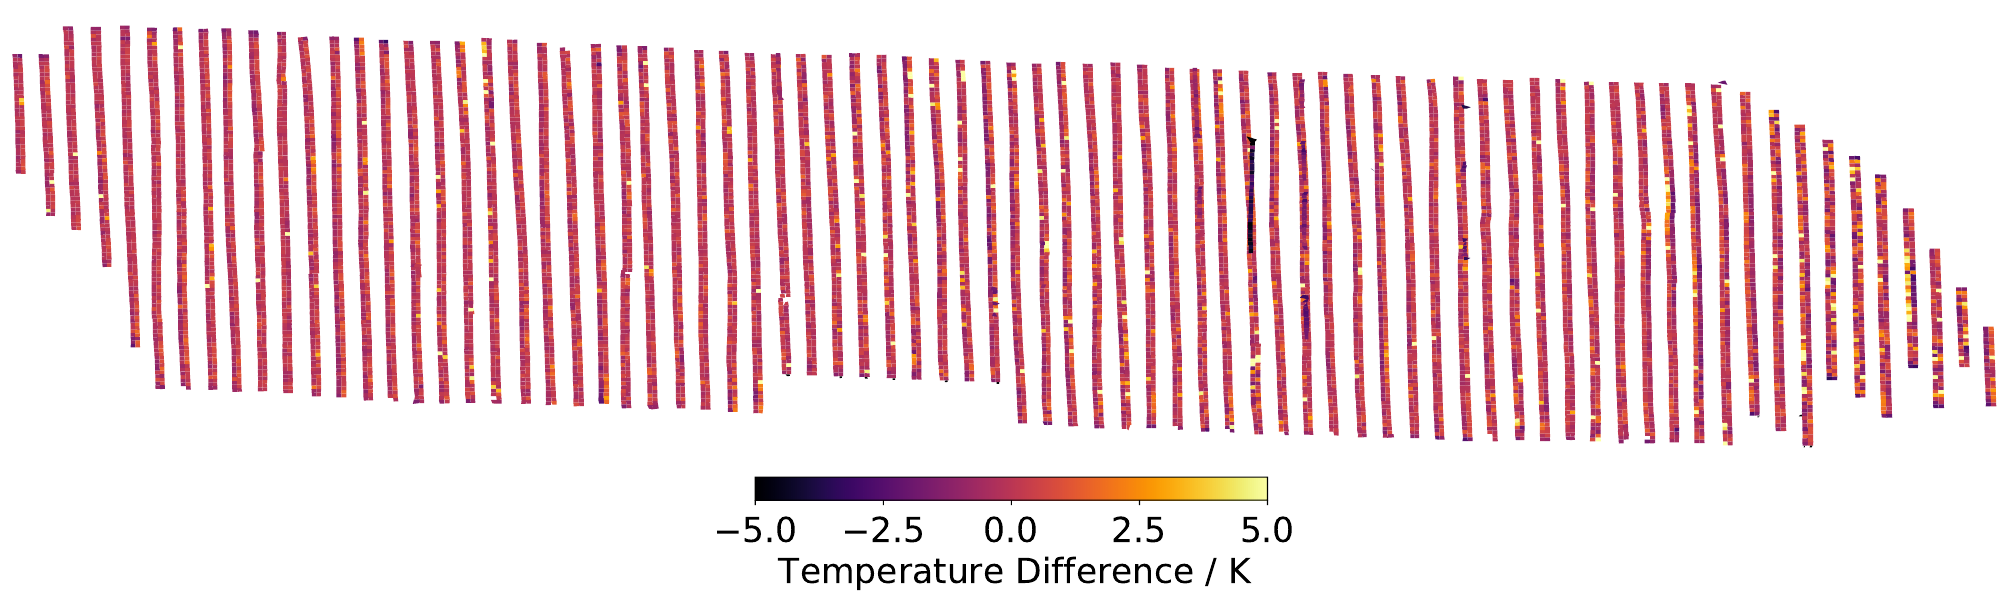 Fig. 7: Trend-corrected distribution of maximum module temperatures facilitates detection of anomalous PV modules.
Practical Relevance: The developed solution for PV plant inspection has been tested on several PV plants in Germany and Brazil with capacities ranging from a few kilowatts to several hundred megawatts. We currently collaborate with a company and an energy provider to deploy the software in combination with an autonomously controlled multicopter on a PV plant for recurring inspections. Thus far, the project has received interest from a large organization and research teams in Spain, Brazil, Saudi Arabia, and Singapore.
Software
I published the developed PV plant inspection solution in the form of two software repositories under the permissive MIT license. In addition, I published a web app for annotating datasets for instance segmentation of PV modules.
PV Hawk
GitHub: https://github.com/LukasBommes/PV-Hawk
Description: PV Hawk implements the computer vision pipeline described above. It contains all functionality for extraction and mapping of PV modules from aerial IR videos. Target audiences are researchers and companies that want to offer inspection of large-scale PV plants.
Technologies: PV Hawk is a command line tool written in pure Python, extensively relying on OpenCV for image processing. Structure from motion is performed with the OpenSfM library, and the g2o framework is used for graph optimization. The entire pipeline is deployed via Docker to ensure fast and easy setup on other machines.
PV Hawk Viewer
GitHub: https://github.com/LukasBommes/PV-Hawk-Viewer
Description: A desktop app (see fig. 8) for viewing reconstructions of large-scale photovoltaic (PV) plants created with PV Hawk. The user can browse individual PV modules on a map. Corresponding infrared video frames and extracted module patches will be shown. The software provides functionality for annotating module anomalies and electrical connectivity of modules. Different kinds of analyses can be performed based on the map and infrared frames. Results can be overlaid on the map. For example, trend-corrected maximum or mean module temperatures can be computed facilitating the identification of many types of module anomalies (see publication [3] for details). Furthermore, a deep learning-based anomaly prediction can be performed (see publication [2] for details).
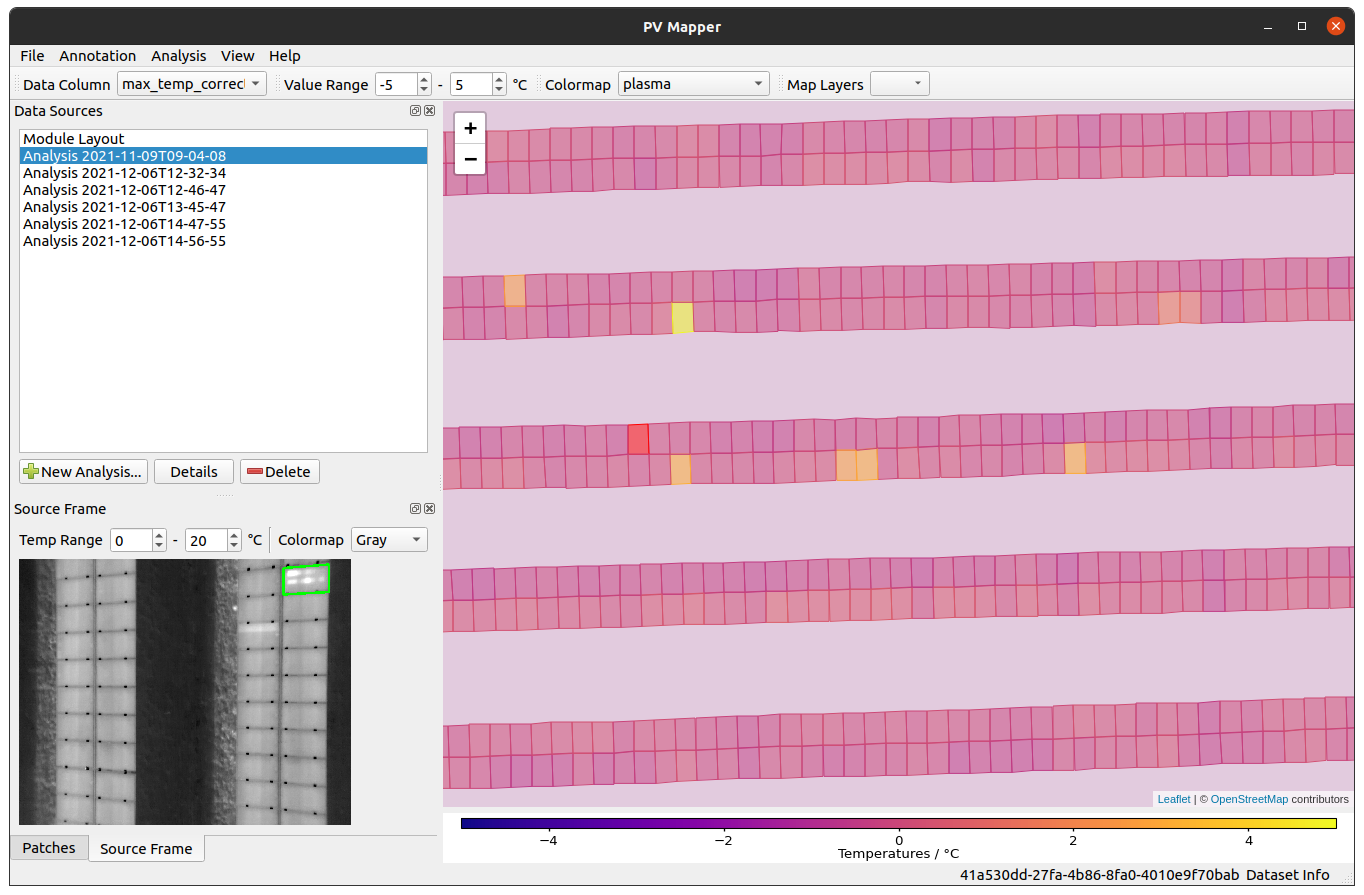 Fig. 8: PV Hawk Viewer for viewing and analyzing reconstructions of large-scale PV plants obtained with PV Hawk.
Technologies: I used the Qt for Python desktop framework to implement the graphical user interface (GUI) in Python. Here, I utilized the model-view-controller pattern to separate data models, application logic and GUI functionality. The map component is based on the Leaflet.js library, written in Javascript and embedded with a QT web engine view. Deep learning models are implemented with PyTorch and PyTorch Lightning. Python distutils are used for packaging and distribution of the application via the Python package index (PyPI).
Note: I built an initial version of this app as web app based on React and Python Flask. The backend functionality (PV Hawk) was placed behind a REST API (realized with FastAPI) and computational workloads were scheduled with Celery. A PostgresSQL database was used. The entire system was distributed over multiple Docker containers that were orchestrated with Docker Compose. However, I decided to switch to a Desktop-app due to the easier to implement and more consistent GUI provided by a Desktop environment.
Grid Annotation Tool
GitHub: https://github.com/LukasBommes/ Grid-Annotation-Tool
Description: A web app for annotating image datasets for instance segmentation (see fig. 9). Opposed to existing labelling tools, such as Labelbox or CVAT, grid-like structures can be annotated faster and more accurately by annotating the grid spines instead of individual polygons. I built this tool specifically for annotating PV modules in infrared images. The created dataset was used to train and evaluate the Mask R-CNN instance segmentation model in PV Hawk (see publication [1] for details).
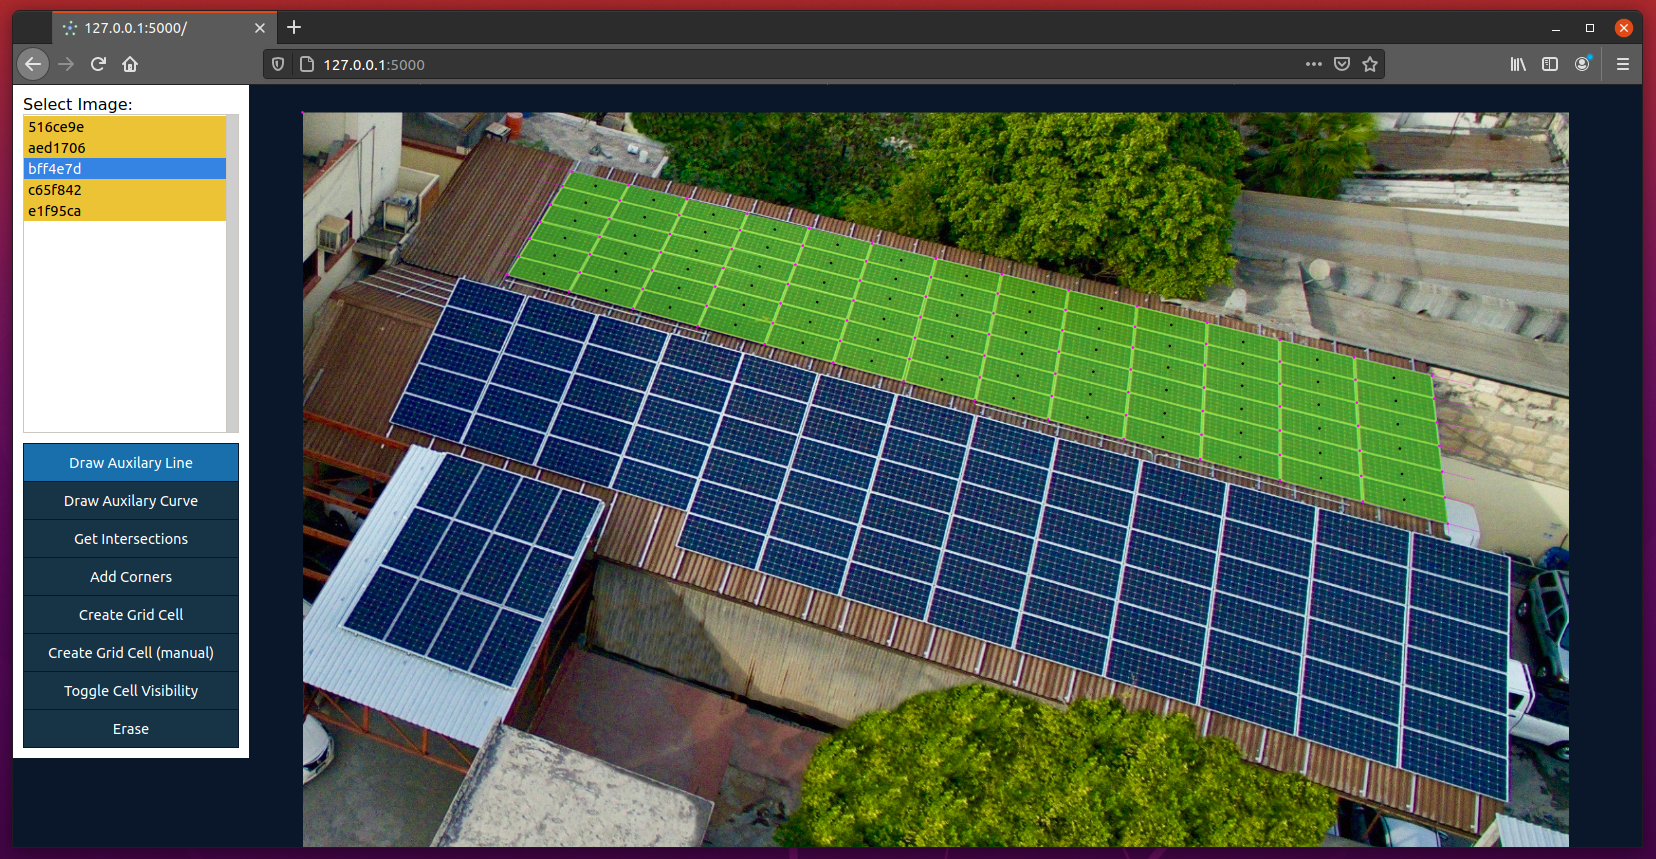 Fig. 9: Grid Annotation Tool helps annotate datasets for the instance segmentation of photovoltaics modules.
Technologies: The backend of this app is based on Python Flask. The frontend is written in Javascript and relies on the D3.js library for drawing.
Related Publications
The following three journal articles were published during this project: [1, 2, 3].